Track record
Real capital, in the open
Stocky (AI, verified) and live Dhan (rule-based algo): the same book I run, shown for transparency.
Stocky, the AI run
fine-tuned Claude Haiku placed every trade itself. Indian F&O and commodities · Jun 2025 – May 2026 · now retired.
Realized P&L · % of ₹15L · holding-period-smoothed.
Stocky goes live
Claude MCP + Haiku · ₹15L · Bank Nifty / Nifty / Sensex weeklies.
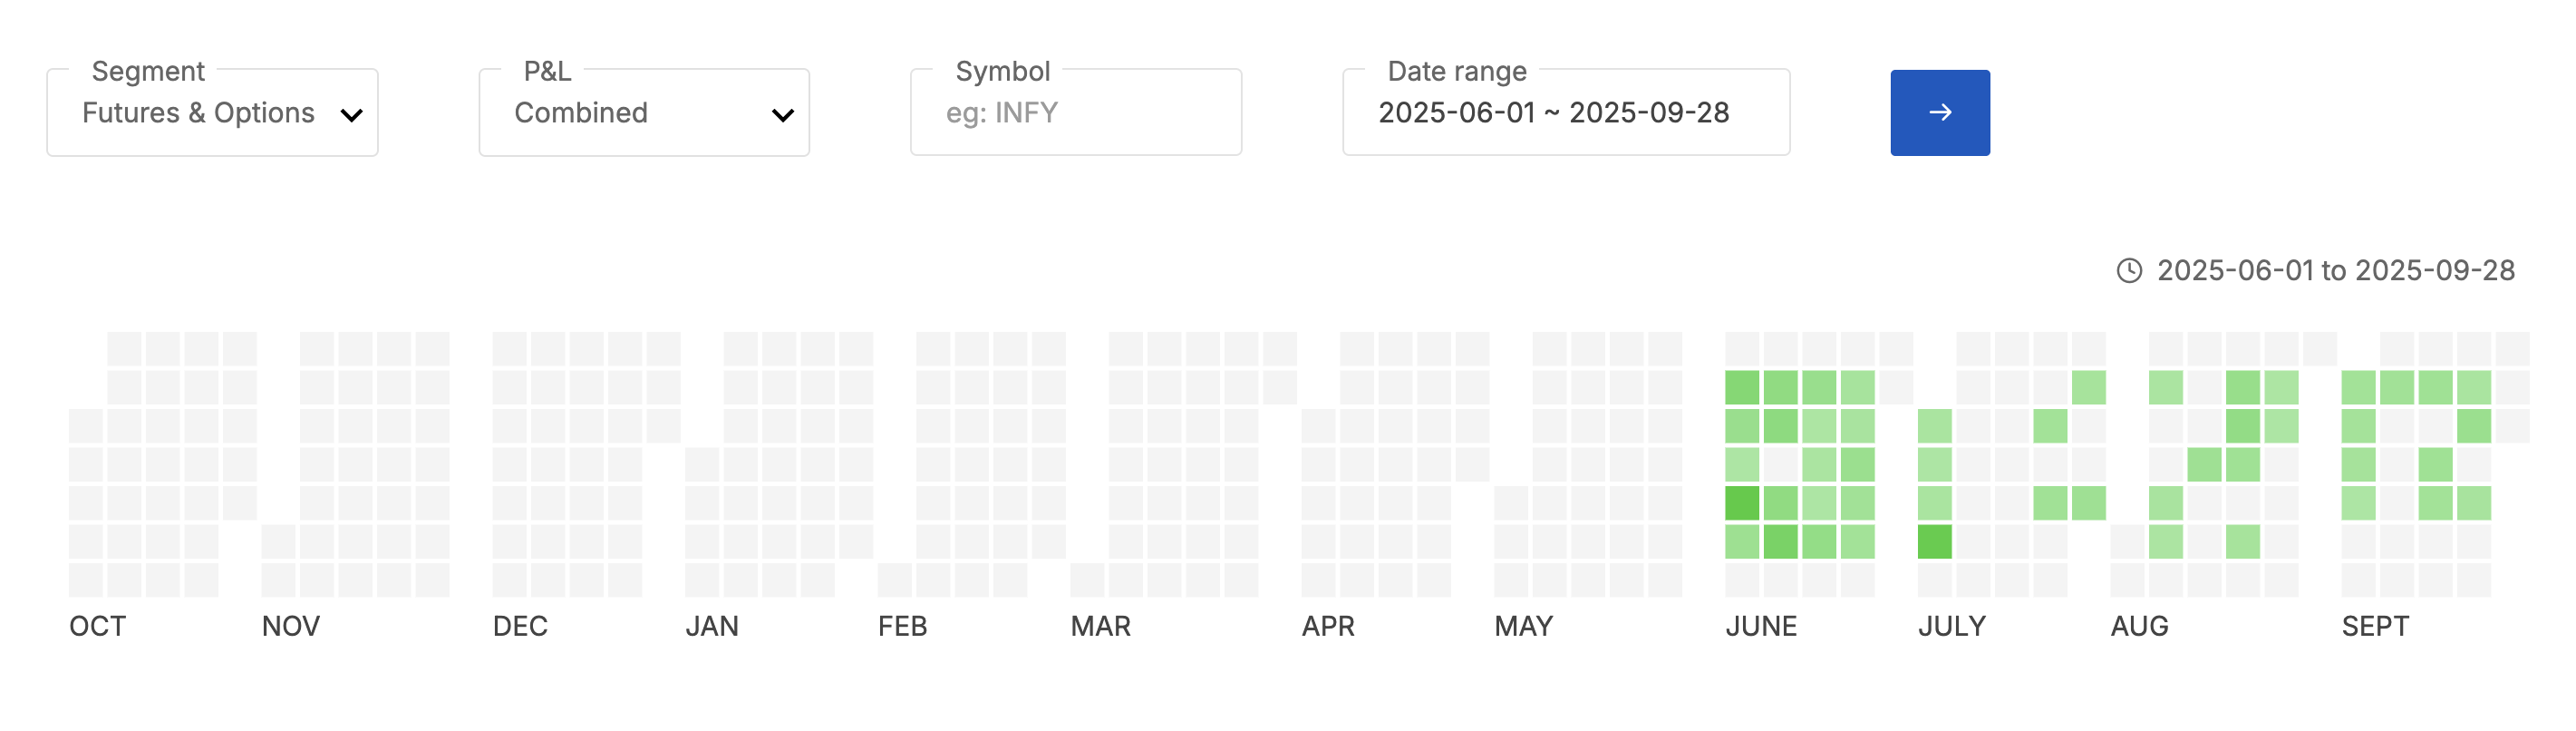
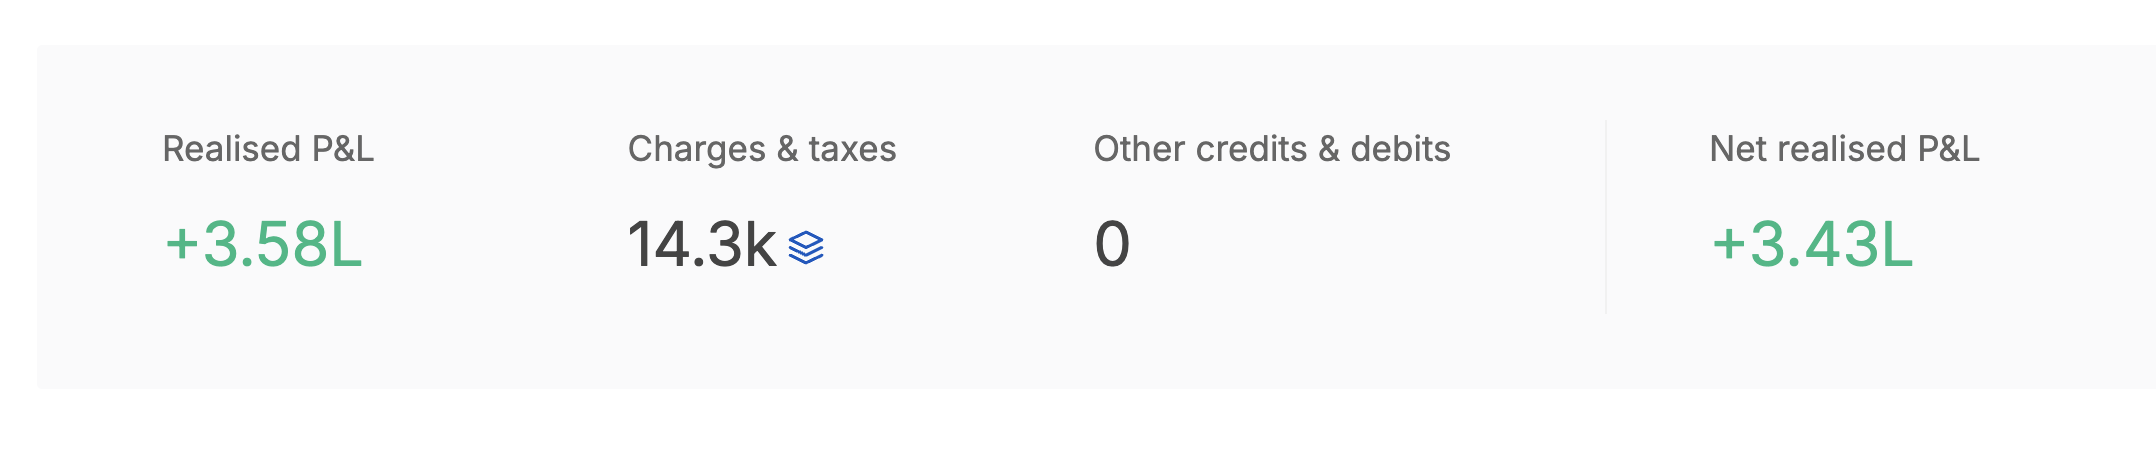
Four months, zero losses
₹3.6L by September · ~₹90k/mo auto-pilot · 51 days · 0 losses.
First loss
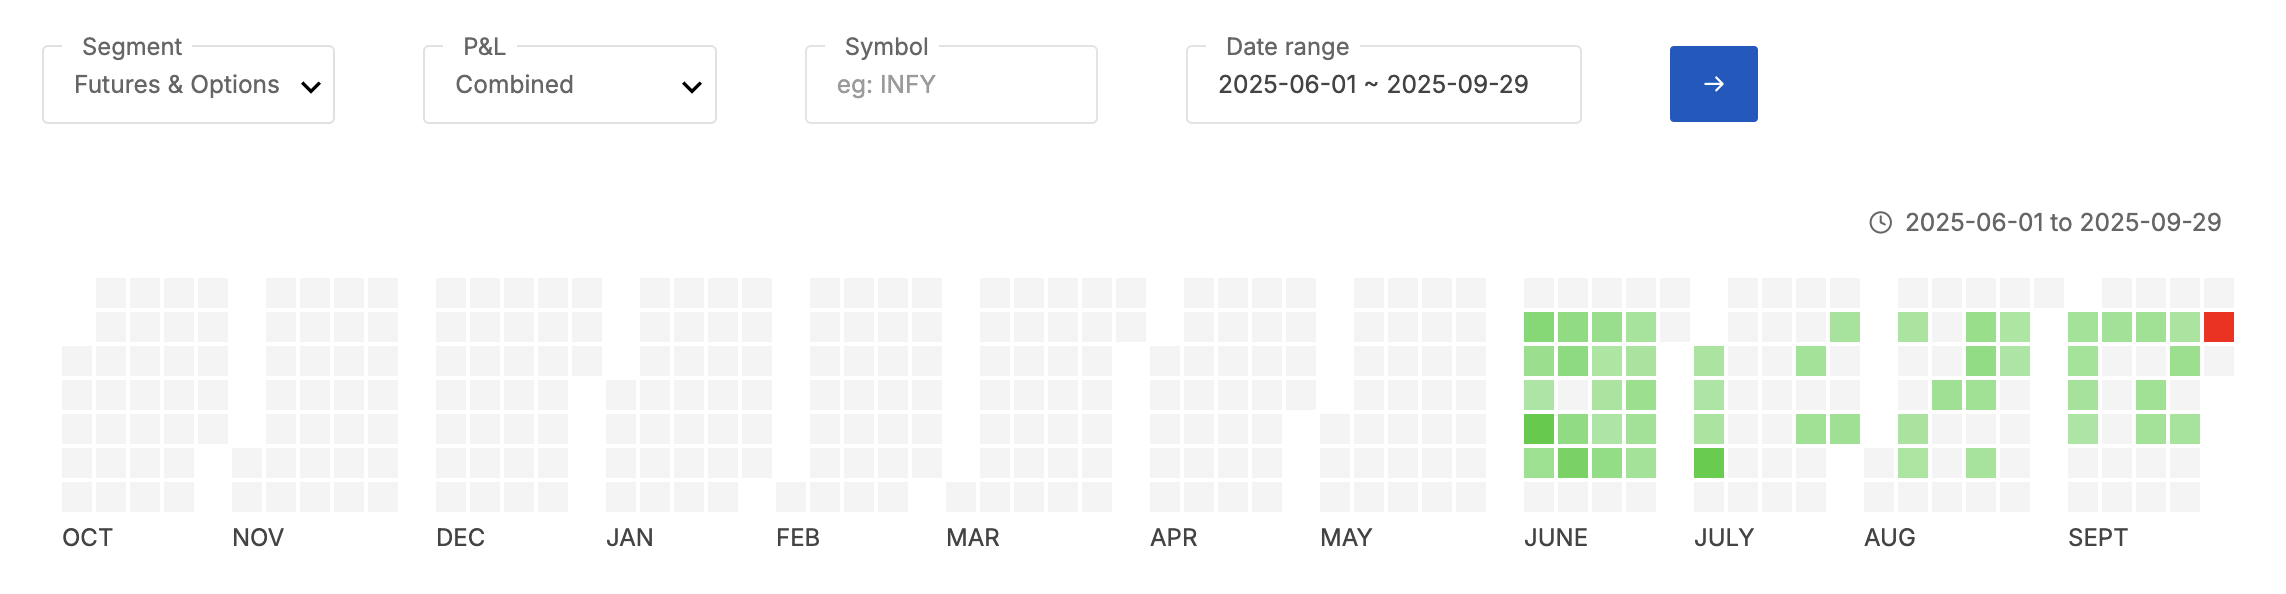
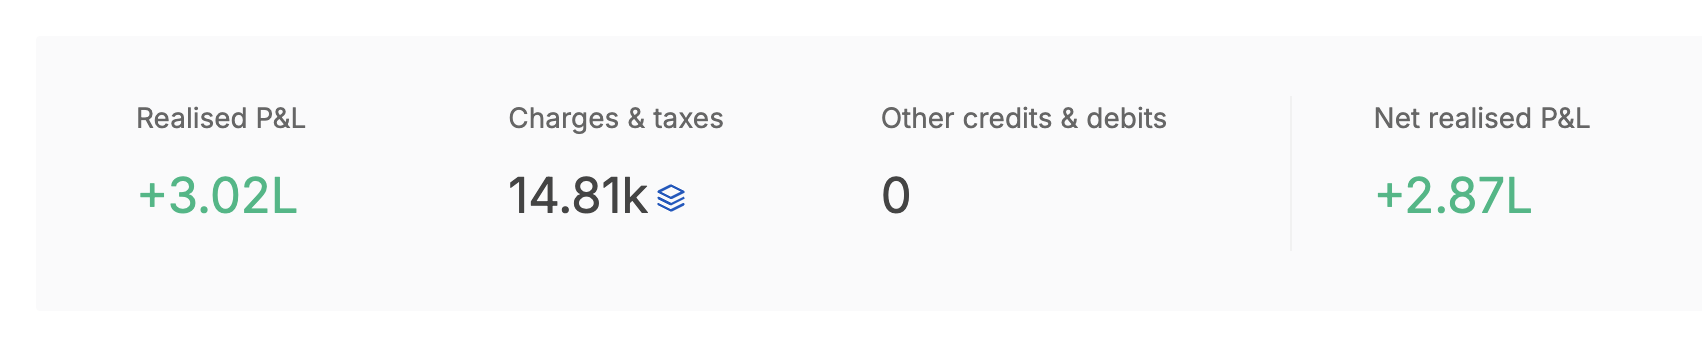
Over-traded volatile names (Eternal, Asian Paints, Tata Motors, BSE) · tightened the universe · net +2.87L after the red day.
Adapt & rebound
Bank Nifty weekly → monthly · explored Deepseek · October rebounded hard.
Second loss
Second loss day of the run · net +3.94L through 24 Nov (two red days on the calendar).
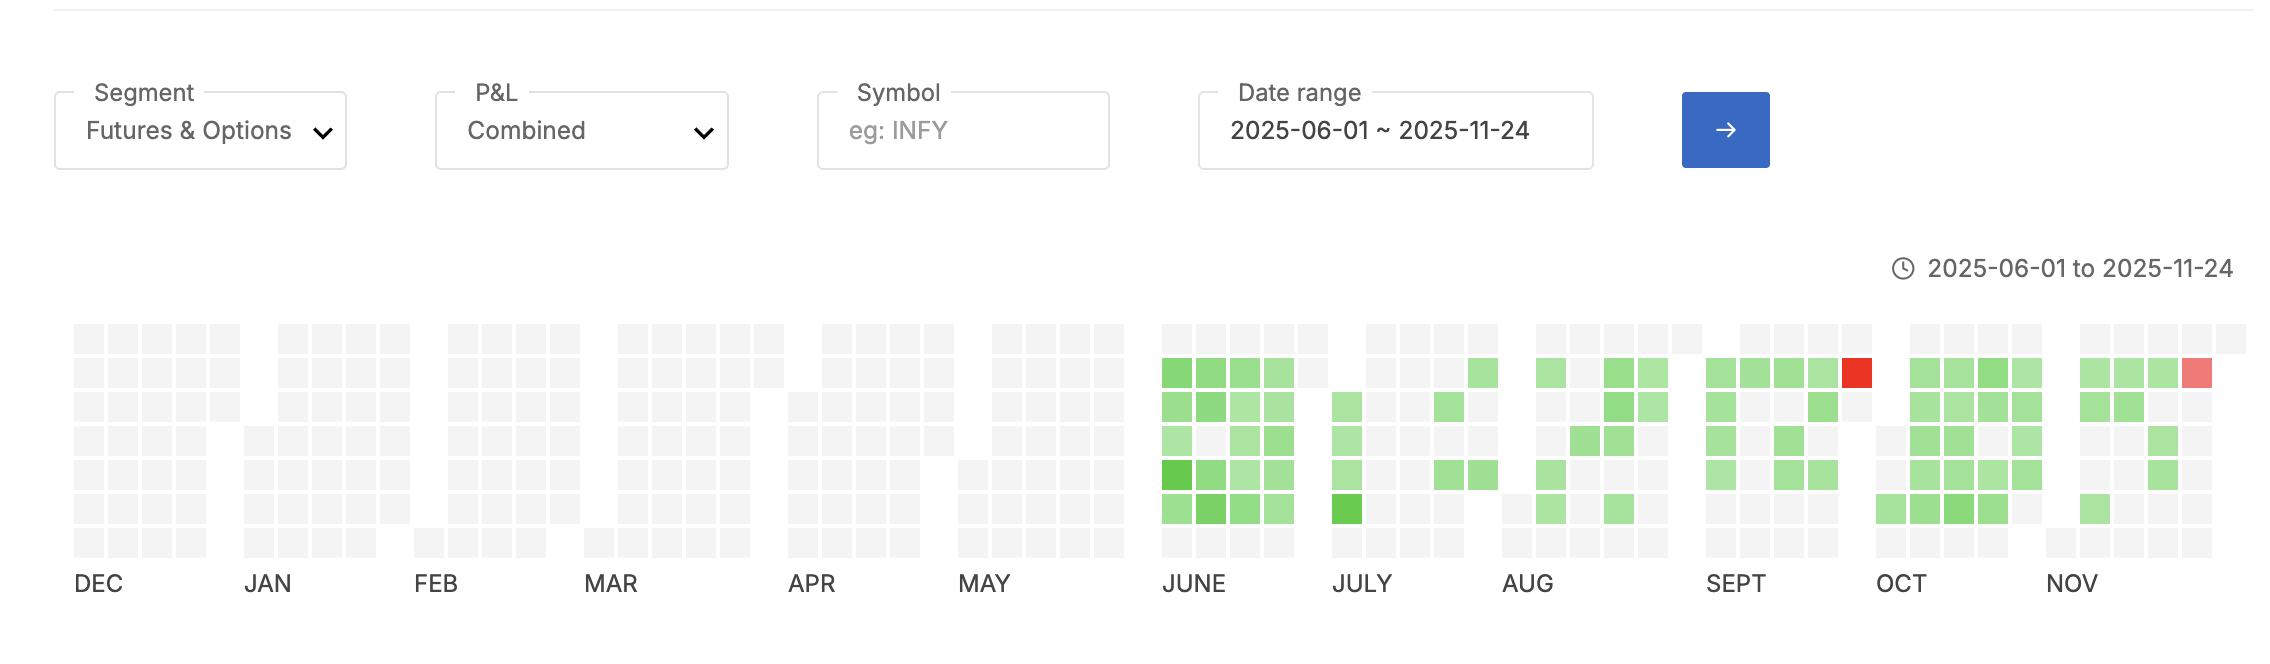

Six months in
₹5.32L PnL · 212 profitable days · only 2 loss days.
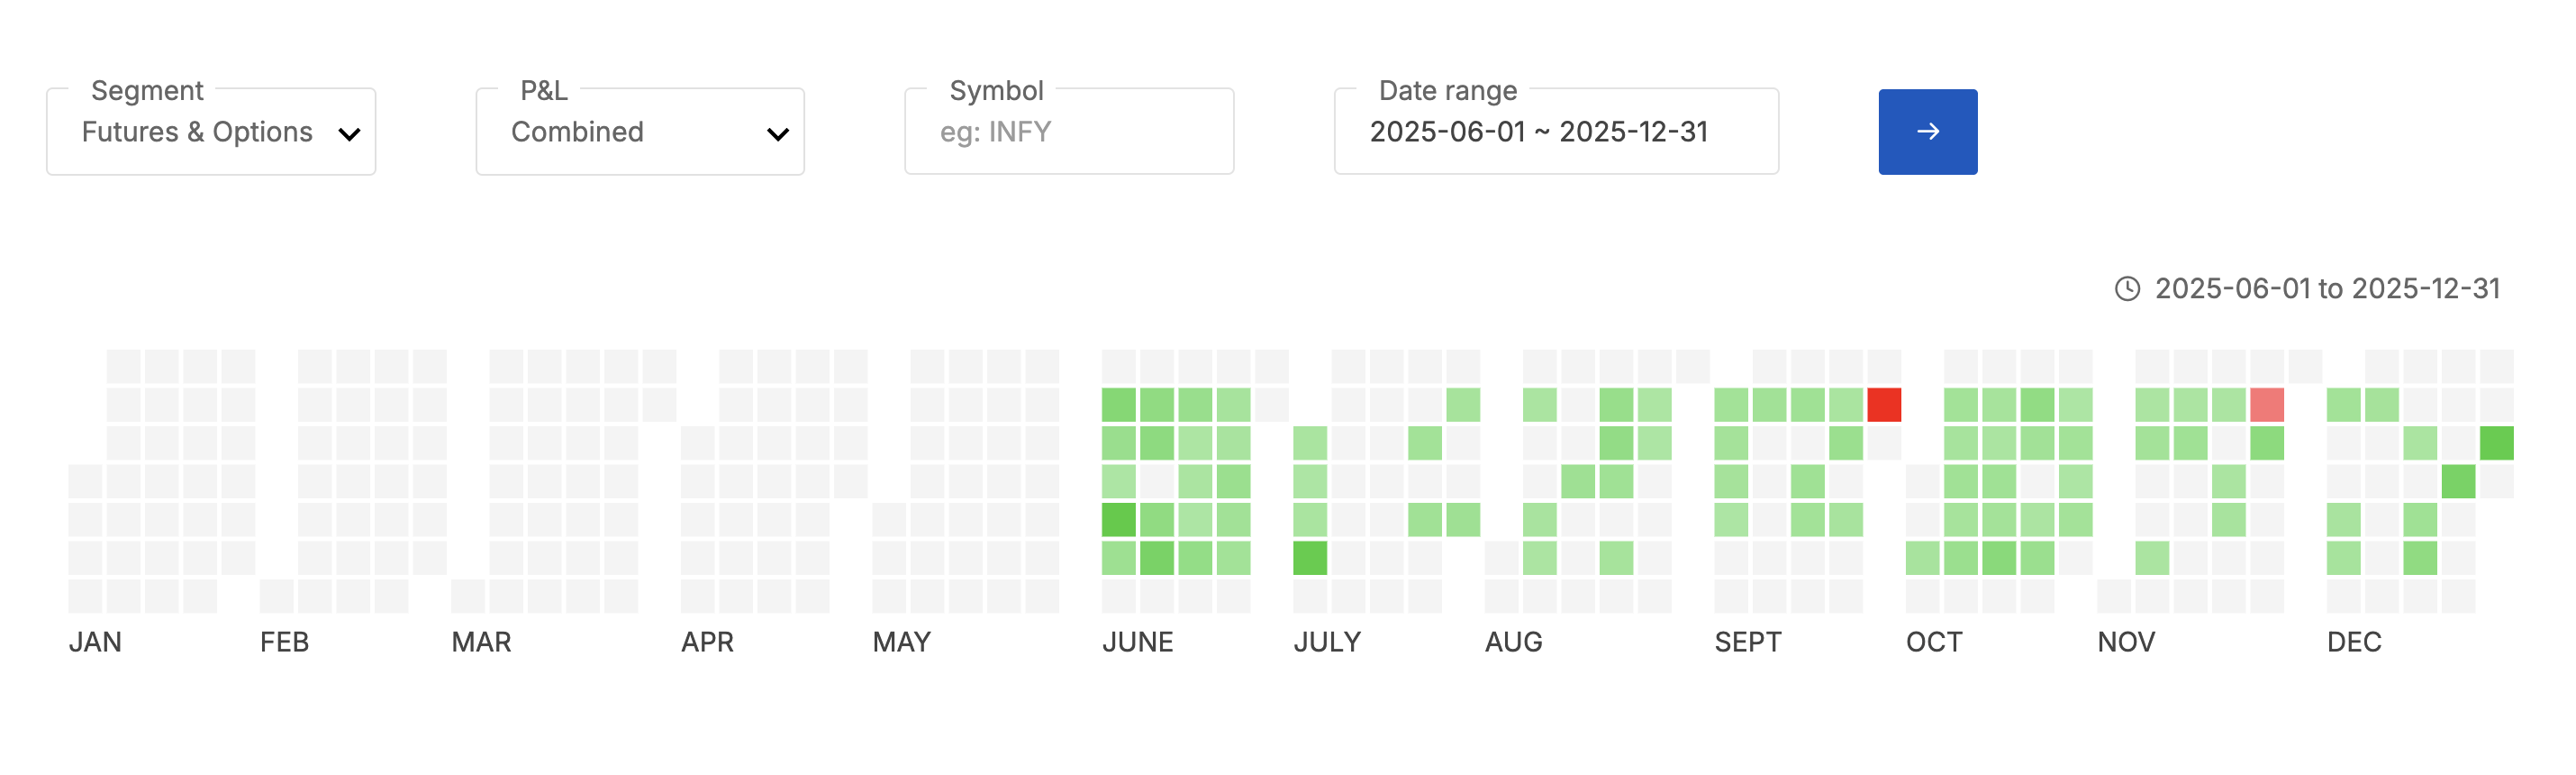
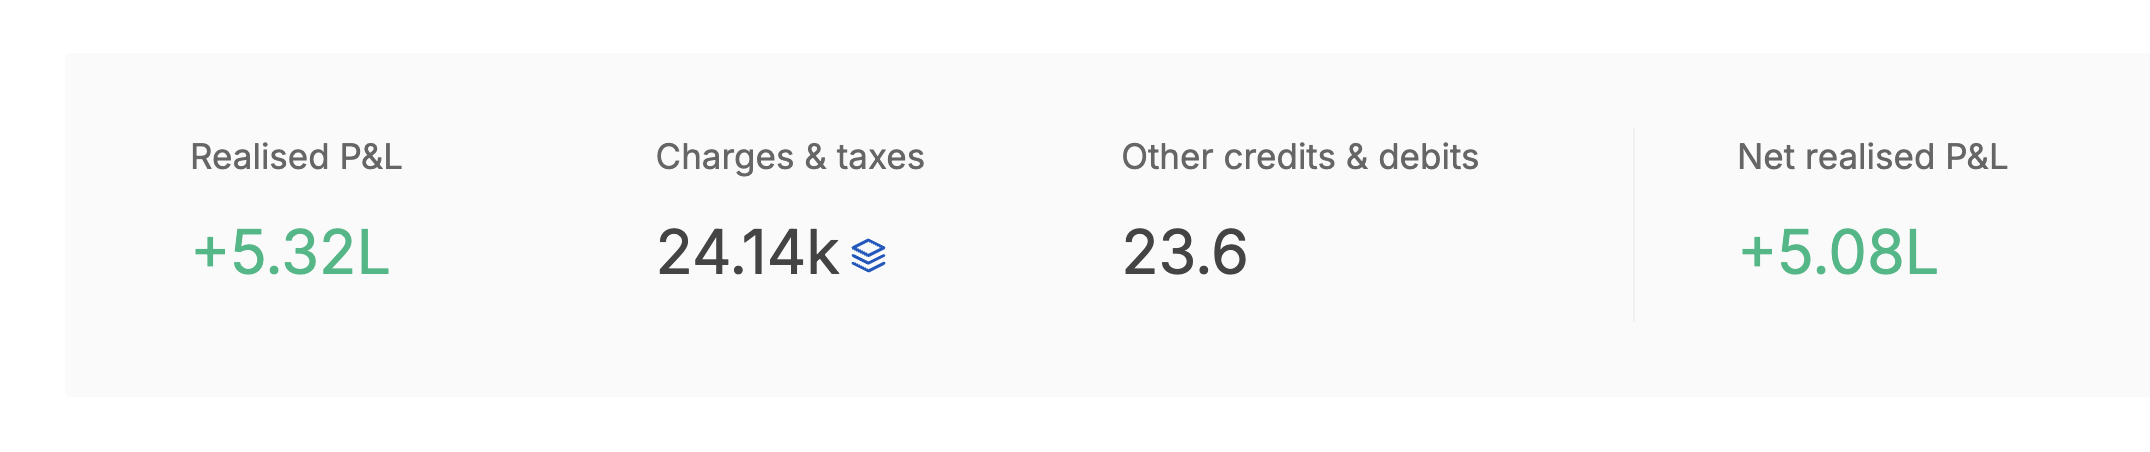
₹15L → ₹31.57L
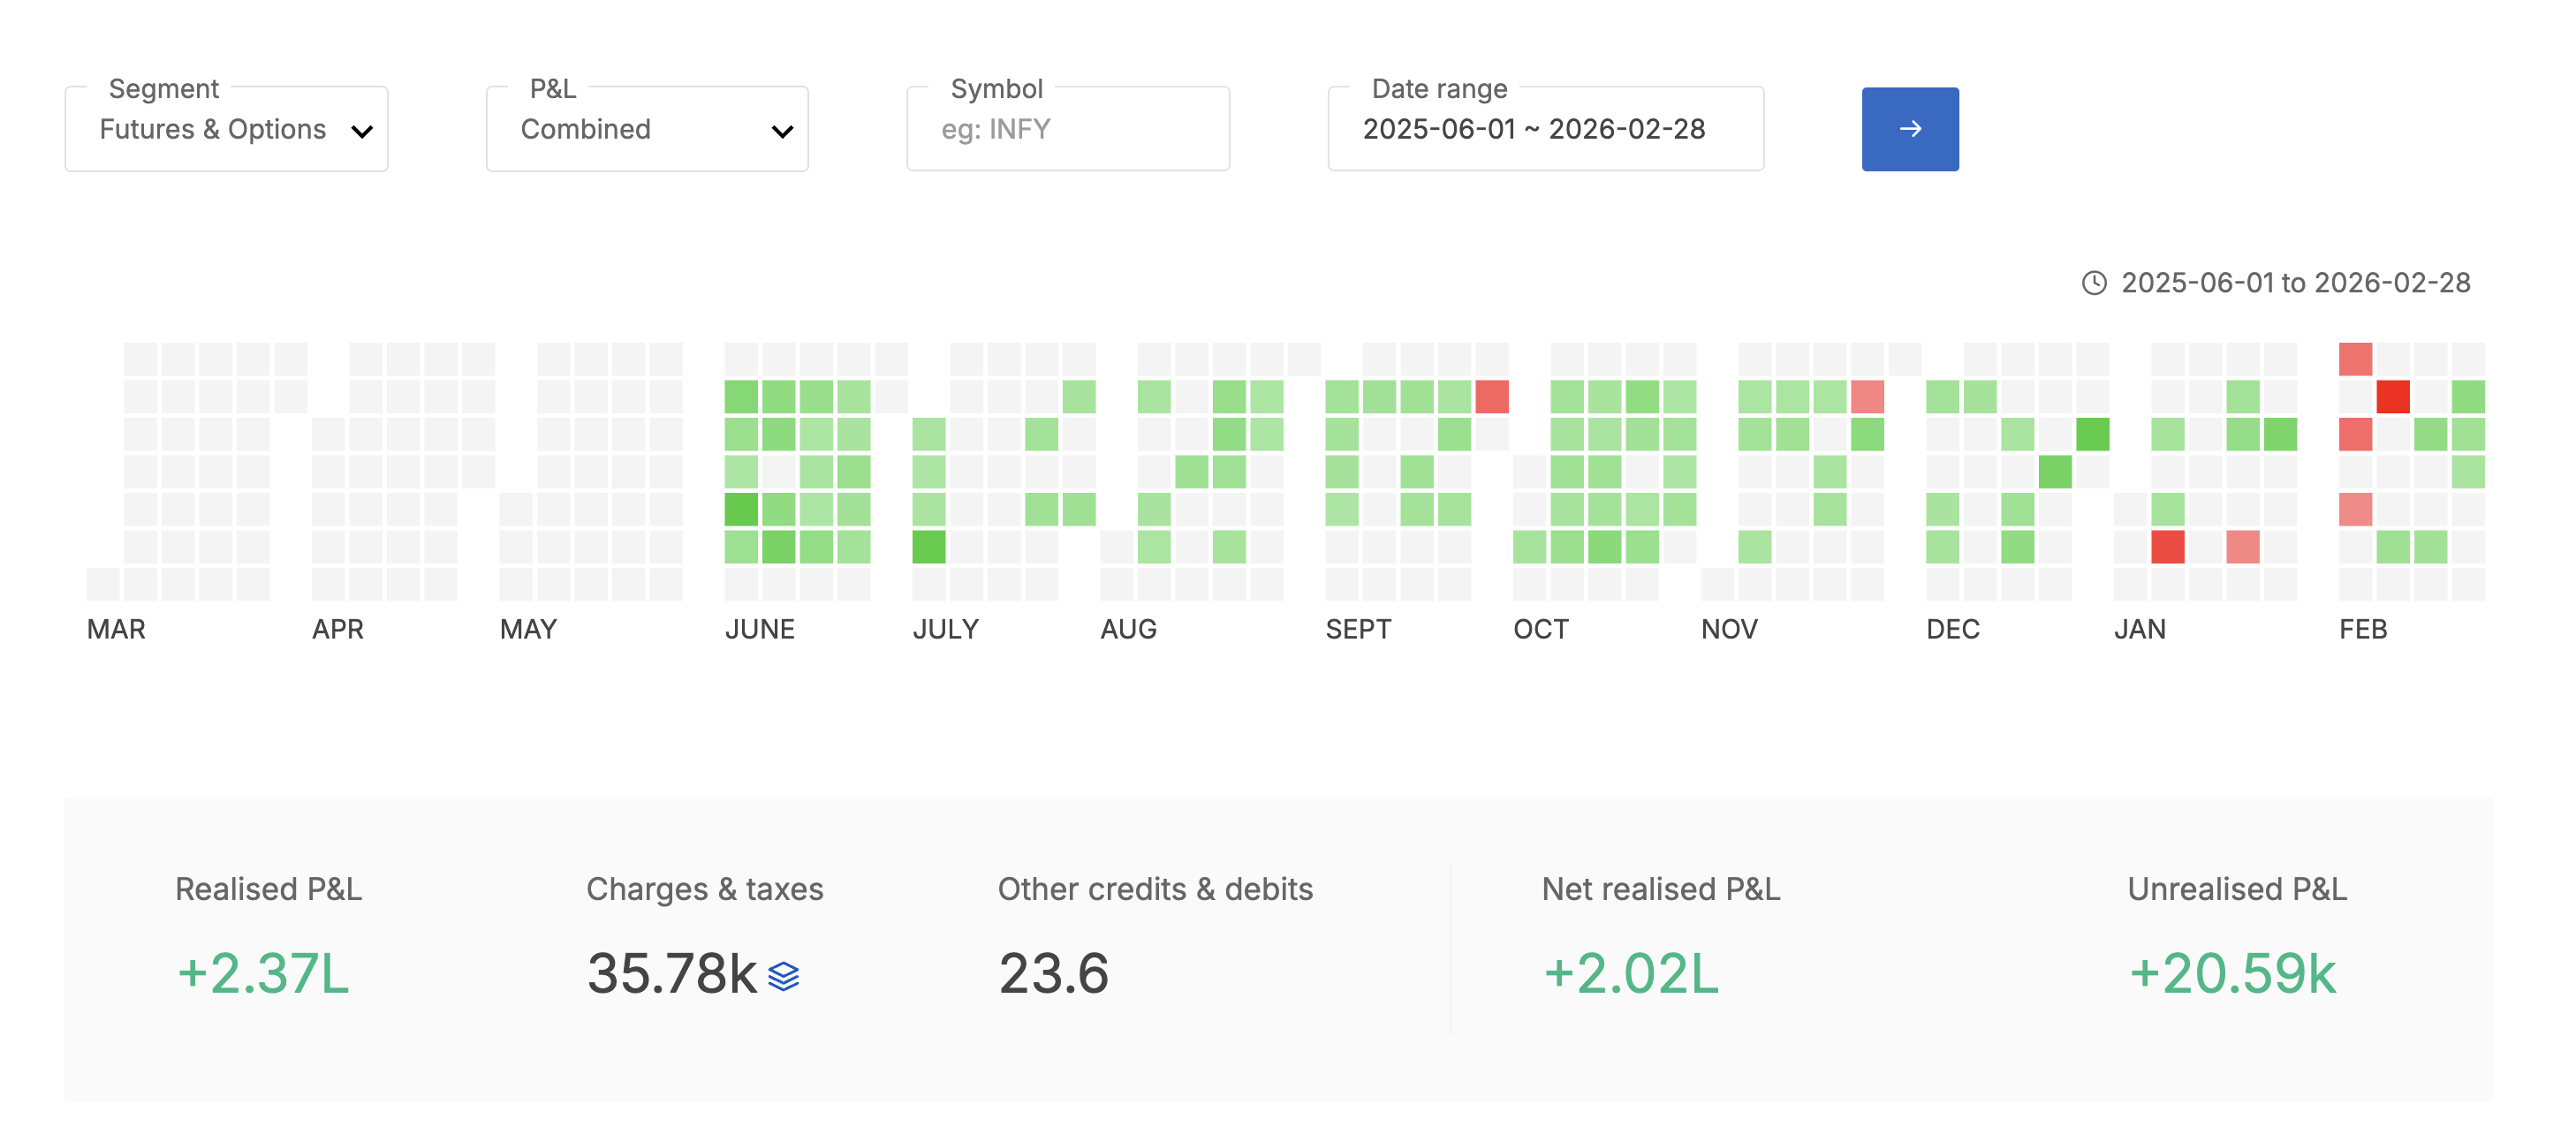
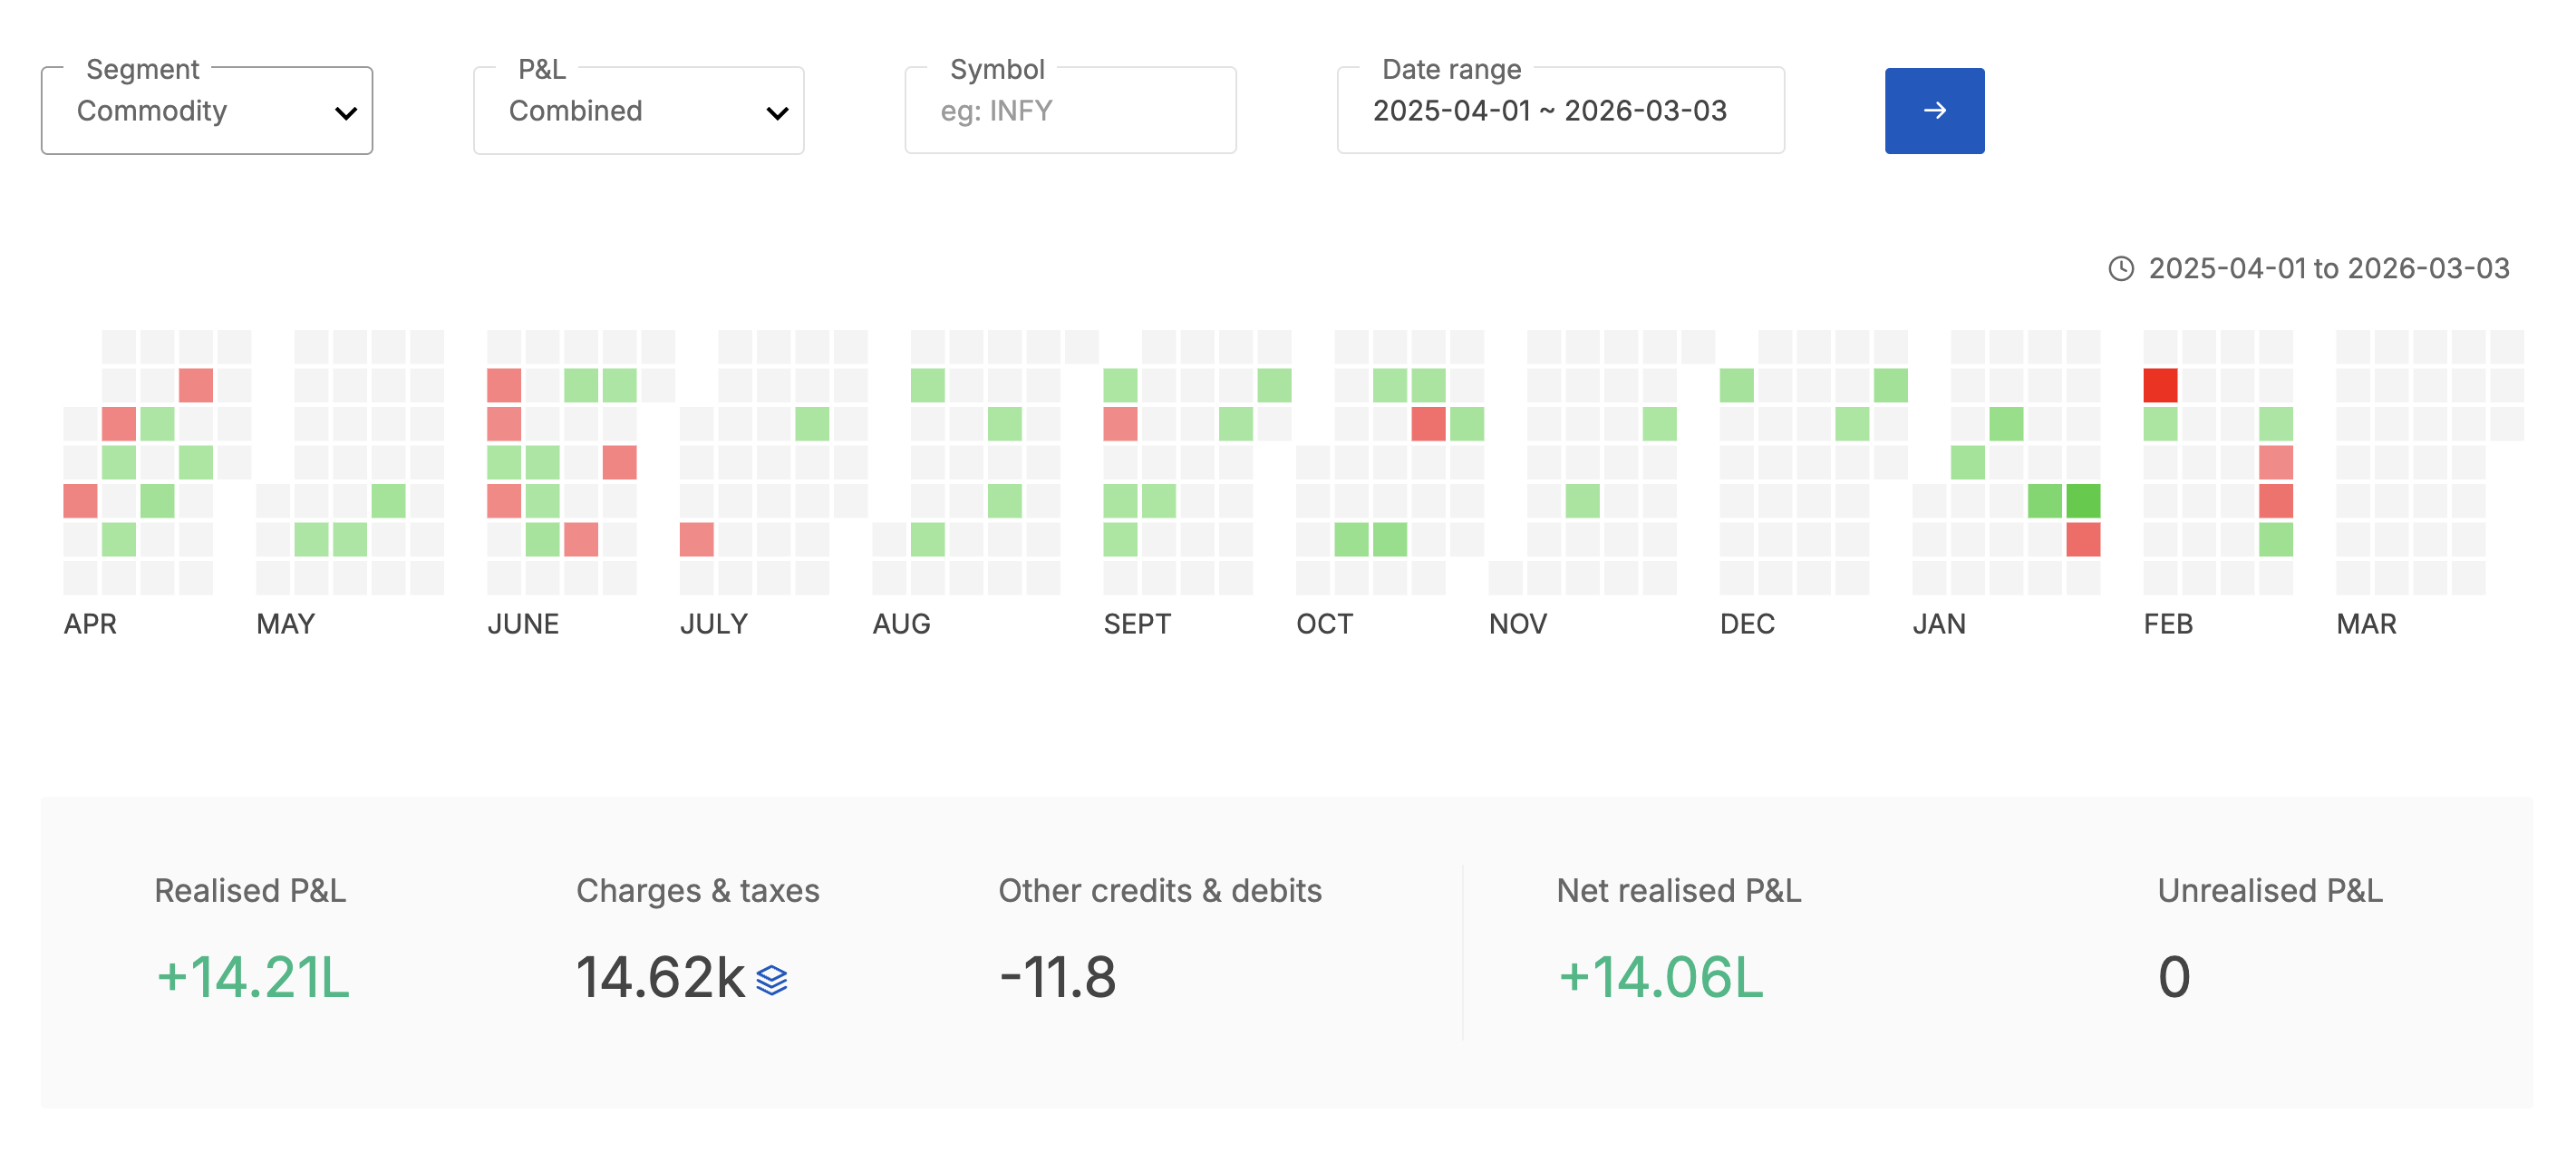
Commodities ₹14.2L + F&O ₹2.37L = ₹16.57L profit · 73% win · Sharpe 2.29 · externally verified.
Dhan, the live book
Rule-based algo. No LLM. Rebuilt daily from the Dhan trade book.
Account metrics · refreshed daily
Window: 1 Aug 2026 onward. The book traded before that date; those days are excluded here.
Risk-adjusted ratios · per active day · N=34 days (small sample)
Disclaimer. An illustrative record of my own personal trading account, shown for transparency and educational purposes only. Not investment advice, a research recommendation, or a solicitation to buy, sell or copy any trade. Past performance is not indicative of future results; derivatives carry substantial risk of loss. I am not a SEBI-registered investment adviser.
Method: reconstructed from my Dhan trade book by FIFO. Headline, calendar and curve show gross realized P&L (matching the Dhan app); the net-of-charges figure (after brokerage/STT) is shown alongside, and each day's drill-down lists both. Risk-adjusted ratios are computed on the net series. The current day is mark-to-market (provisional). Stats use settled days only; open-day figures are excluded. Sharpe is per-active-day, annualized by root-252 (no-position days excluded, so not calendar-annualized), risk-free = 0. Drawdown-% is on a declared capital base. Ratios come from a small sample (34 active days) and will move materially as the record grows. Single account, single regime, no benchmark.
Want to run this yourself? Mirror this book on your own account ↗